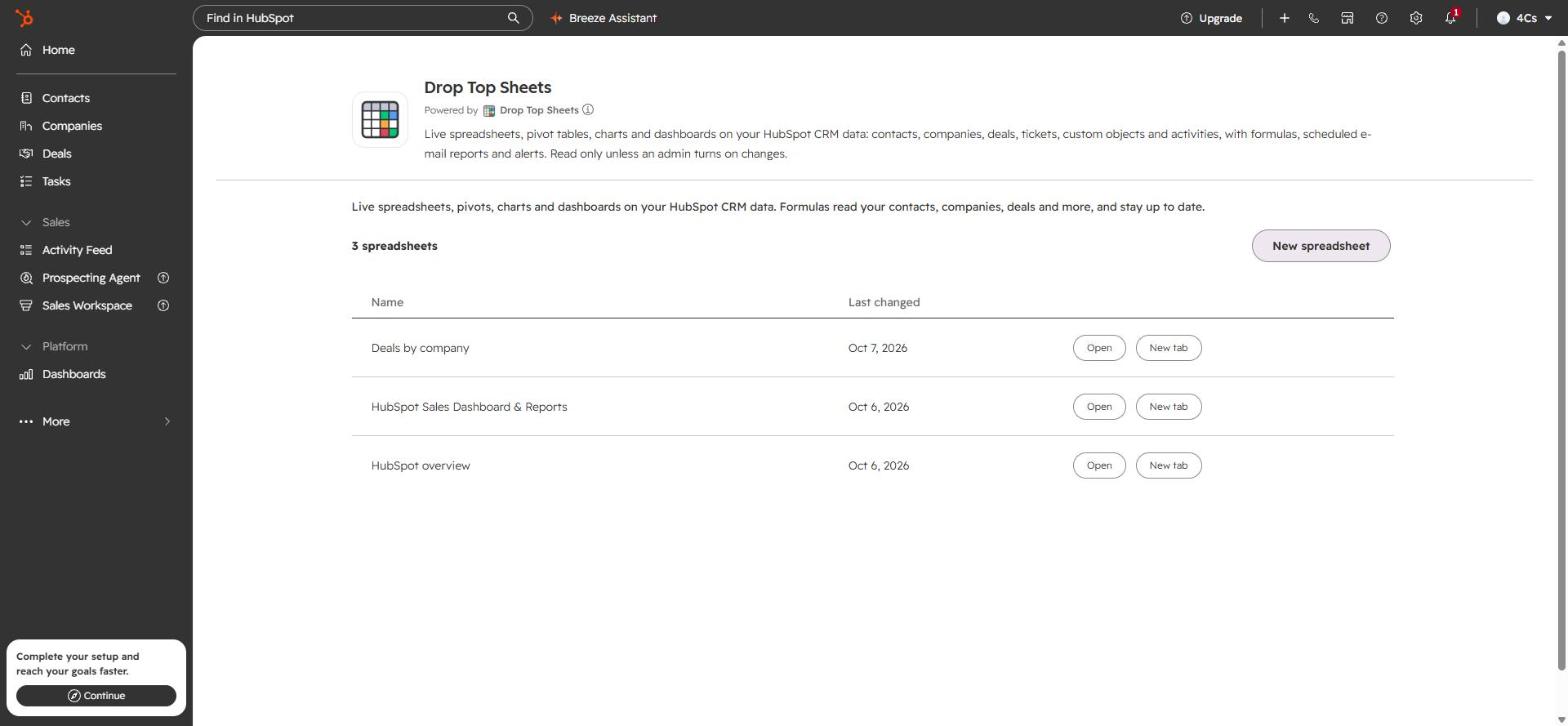
Drop Top Sheets
Live spreadsheets, dashboards and scheduled reports on your HubSpot CRM data.
Works with HubSpot. Install from HubSpot
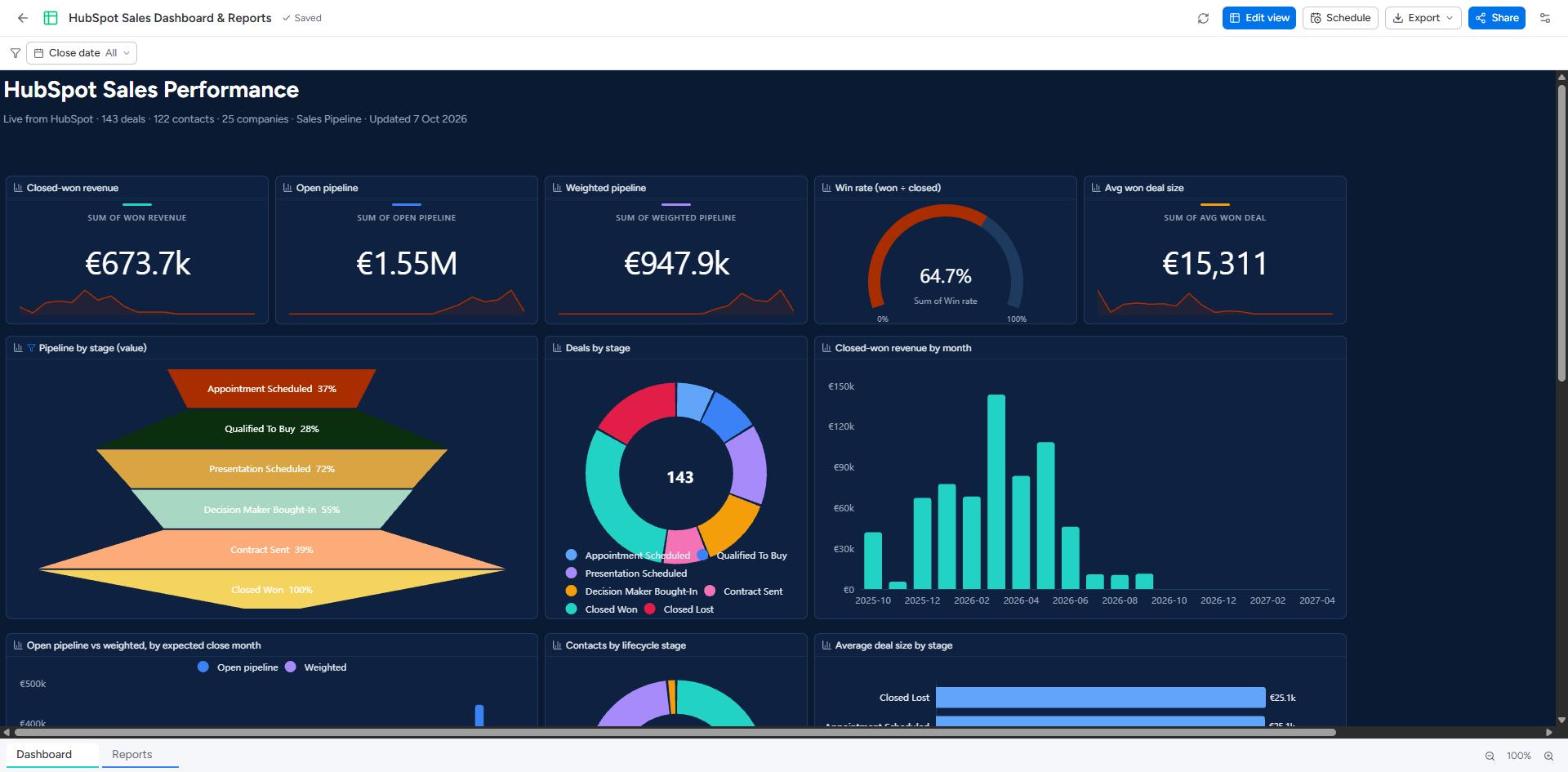
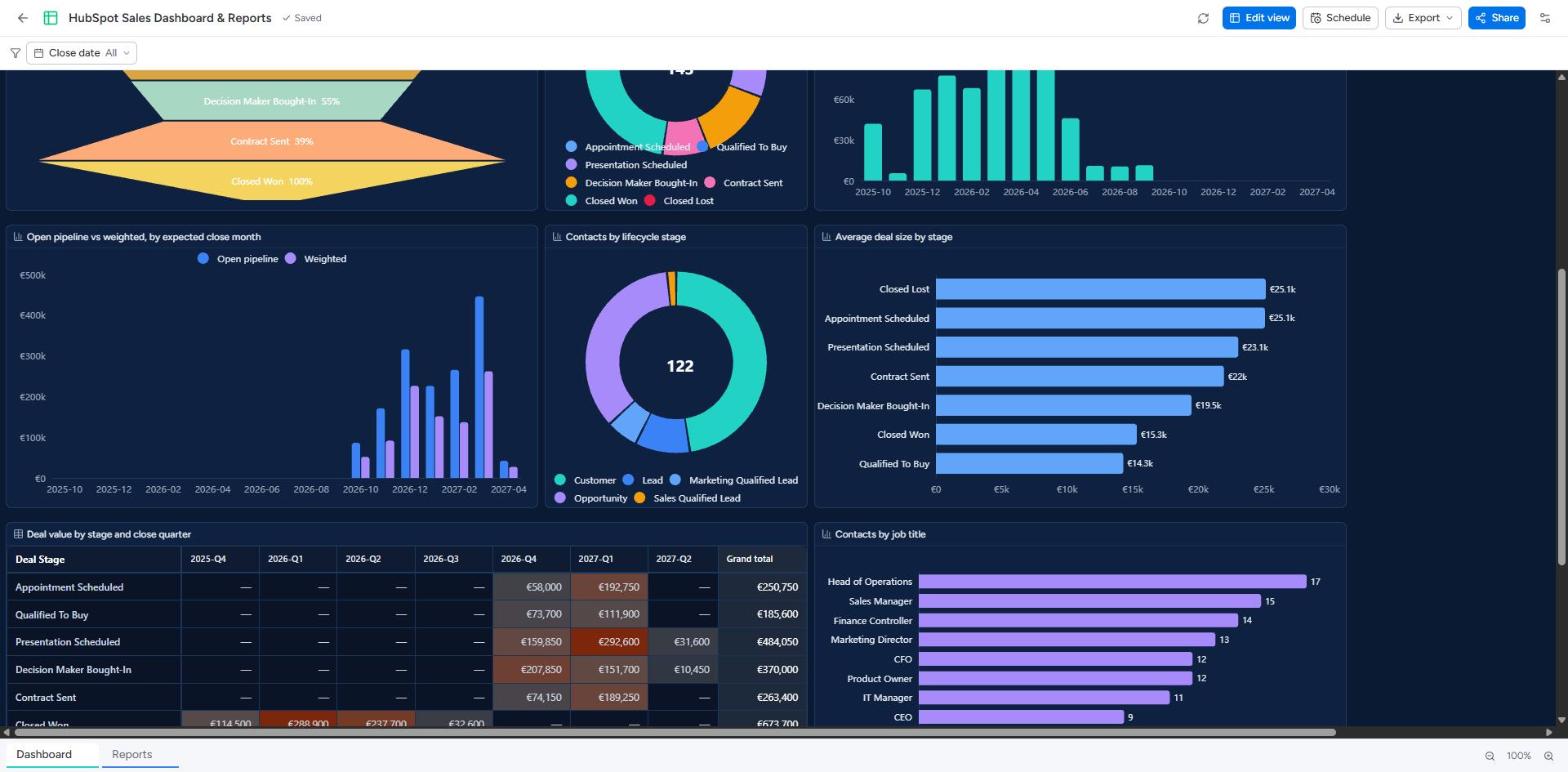
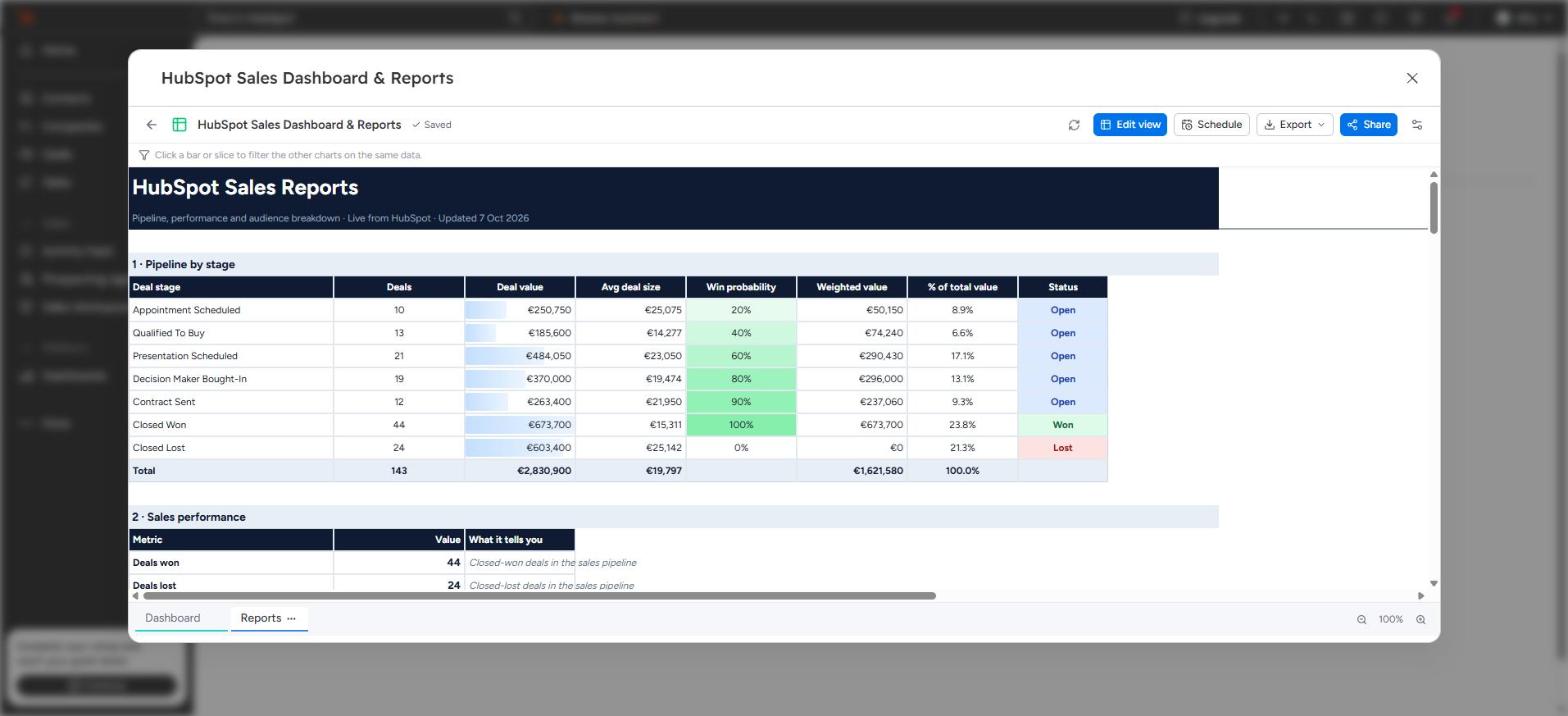
Drop Top Sheets turns your HubSpot account into live spreadsheets, pivot tables, charts and dashboards. Contacts, companies, deals, tickets, line items, quotes, custom objects and activities (calls, meetings, notes and tasks) become tables that spreadsheet formulas read directly, so your numbers stay up to date without exporting. Open it inside HubSpot, under Marketplace apps or from the Sheets card on a contact, company or deal record, or full screen in a new tab.
- Every property is a column, custom properties included, with option labels, stage names and owner names as HubSpot shows them.
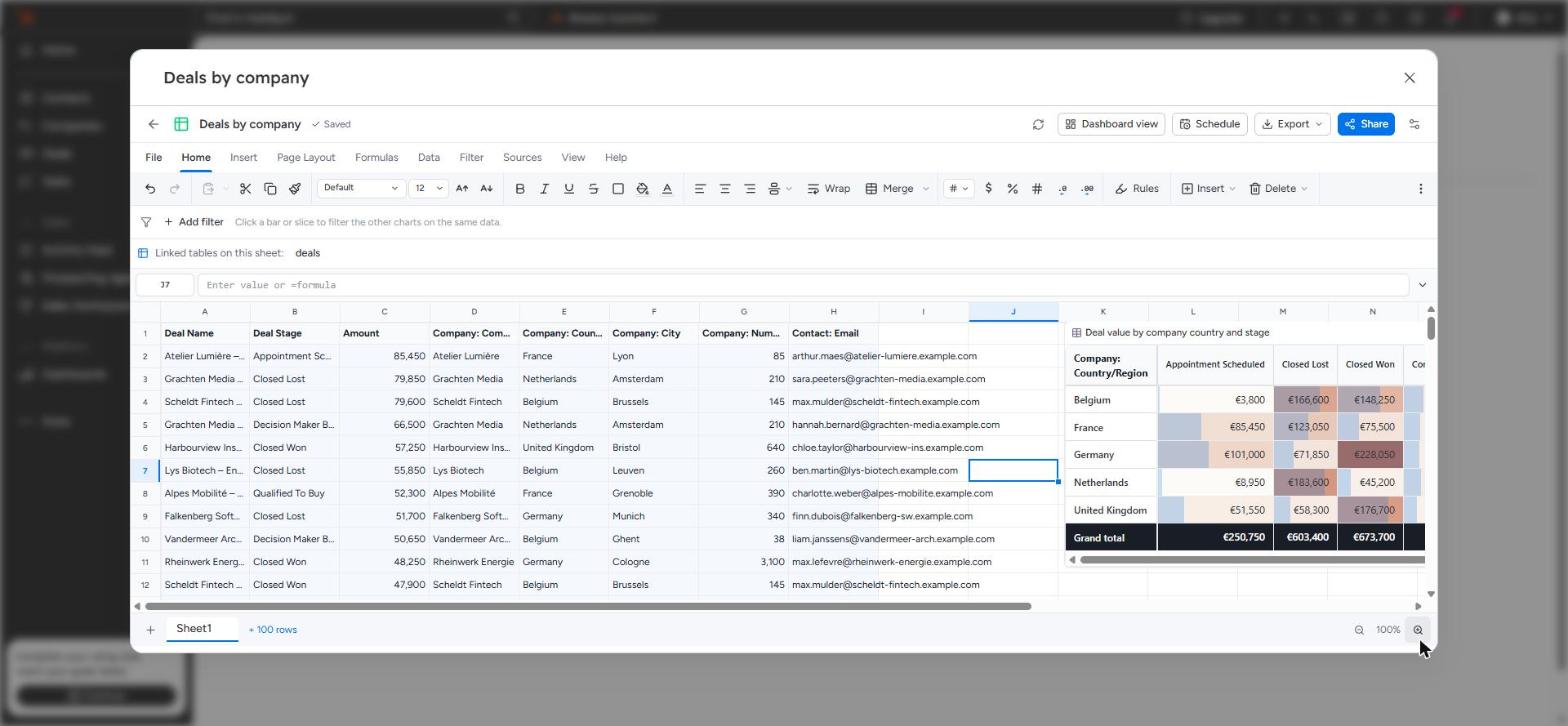
- Linked records are columns too: each row carries the names and record IDs of its linked records, and a deal carries its company's country, industry and number of employees and its contact's e-mail address, so you can pivot deals by company country without formulas.
- Formulas such as
=data.deals.sum(amount, deal_stage, "Closed won")and=list.deals(deal_owner)work next to any spreadsheet function. - Pivot tables, charts and dashboards with filters; exports to .xlsx and PDF; share links.
- Scheduled e-mail reports and alerts from your own mailbox, and AI assistants through MCP.
Drop Top Sheets reads your CRM data. It changes HubSpot records only when an admin turns changes on, and only for people who can manage apps in HubSpot.
10 tables from your HubSpot account
Add any of them to a spreadsheet as a data source. Each table's page lists its columns and the formulas that use them.
Each account's columns are its own HubSpot properties, custom ones included. The columns listed here are HubSpot's standard properties; custom objects are tables too (Enterprise).
CRM
data.contacts Companies 31 columns · data.companies Deals 44 columns · data.deals Service
Commerce
Activities
Reports people build first
One formula each. Put it in a cell, fill it down a column, or turn the table into a pivot and a chart.
=data.deals.sum(amount, deal_stage, "Closed won") =data.deals.sum(amount, deal_stage, A2) =data.deals.sum(amount, deal_owner, A2, deal_stage, "Closed won") =data.deals.sum(amount, deal_stage, "Closed won", close_date, ">=2026-01-01") =data.deals.sum(amount, company_country_region, A2) =data.deals.avg(amount, company_industry, A2, deal_stage, "Closed won") From connection to a live report
- ConnectInstall Drop Top Sheets from HubSpot and open it under Marketplace apps or on a contact, company or deal record. It reads your CRM data; changes stay off unless an admin turns them on.
- Add dataAdd the tables a sheet needs as data sources, each under a short name.
- Write formulasUse =data.<name>.sum(…) next to any spreadsheet function, or build pivots and charts.
- Share and scheduleShare the sheet with colleagues, export to .xlsx or PDF, or e-mail it on a schedule.
Questions
Does Sheets change anything in HubSpot?
Not unless you allow it. By default Sheets reads your CRM data. An admin can turn on "Allow changes from Sheets" and grant HubSpot write access separately; then only users who can manage apps in HubSpot can send changes, and a record changed in HubSpot since the edit is refused.
Which HubSpot data can a sheet use?
10 tables: contacts, companies, deals, tickets, line items, quotes, calls, meetings, notes, and tasks, plus each custom object (Enterprise). Every property is a column, custom properties included, with option labels, stage names and owner names as HubSpot shows them.
Can I report on deals by company?
Yes. Each row carries the names and record IDs of its linked records, and a deal also carries its company's key fields (Country/Region, Industry, Number of employees) and its contact's Email. Pivot deals by company country without formulas, or join tables with XLOOKUP or SUMIFS on Record ID.
How current are the numbers?
Sheets reads HubSpot when a sheet opens or refreshes, and keeps data at most in a short-lived cache, so formulas show your CRM as it is now.
Can I send reports by e-mail?
Yes. A sheet can be sent on a schedule as PDF or .xlsx from your own mailbox, and alerts tell you when a figure crosses a limit.
Live spreadsheets on your HubSpot CRM data
Contacts, companies, deals, tickets and activities become tables that formulas, pivot tables and charts read directly, opened inside HubSpot. Your numbers stay current without exporting.
HubSpot is a trademark of HubSpot, Inc.